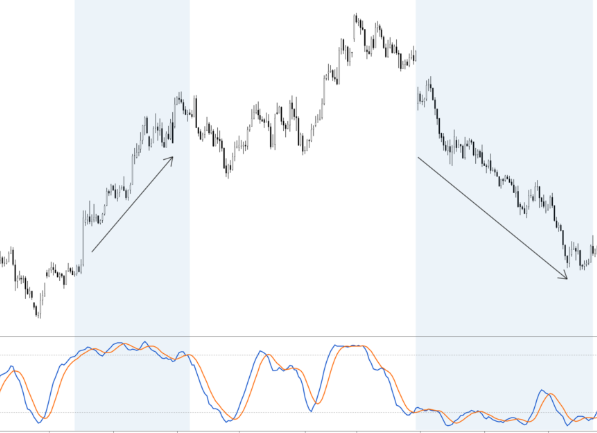
In the world of trading, the stochastic oscillator stands as a vital tool for assessing the momentum behind price movements. Momentum, essentially the rate of acceleration in price movement, forms the cornerstone of this indicator’s utility. The core idea underpinning the stochastic indicator revolves around the belief that an instrument’s price momentum often shifts before the actual direction of the instrument changes. Consequently, this indicator proves invaluable in predicting trend reversals with precision. Utilizing the Stochastic Oscillator for Traders of All Levels Whether you’re an experienced trader or someone new to the world of technical analysis, the stochastic oscillator can become a valuable asset in your trading toolkit. When coupled with other technical analysis tools like moving averages, trendlines, and support and resistance levels, the stochastic oscillator enhances trading accuracy and assists in identifying opportune entry and exit points. The Stochastic Calculation Demystified The calculation process of the stochastic indicator hinges on analyzing a price range over a specified time period or a series of price candles, with the typical settings involving a 14-period/price candle configuration. It compares the highest […]

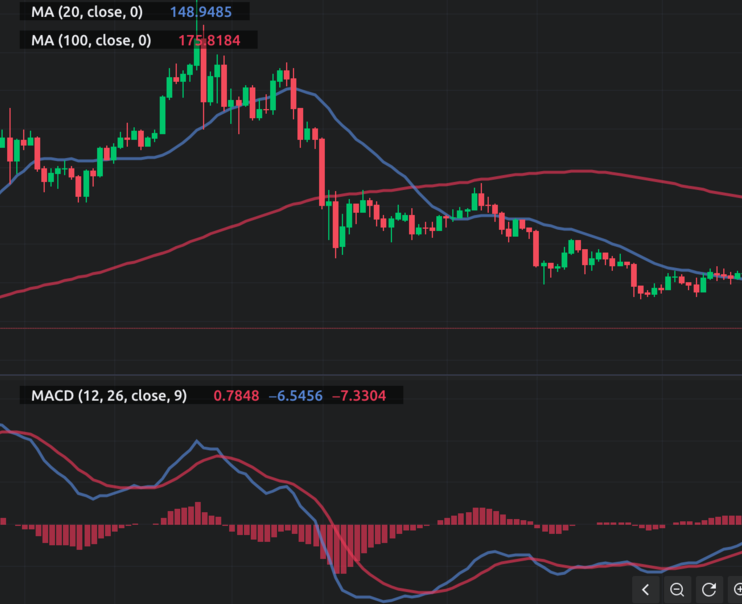
Trading is a thrilling activity that can lead to financial independence if done correctly. As a trader, the use of charts and indicators is essential in making informed decisions. One such indicator is the Moving Average Convergence Divergence (MACD) which is a popular tool among traders. In this article, we will dive into how you can use MACD to boost your trading strategy and achieve financial success. MACD is a trend-following indicator that uses moving averages to identify changes in the trend direction. The indicator is made up of two lines, the MACD line and the signal line, both of which are derived from moving averages. The MACD line is calculated by subtracting the 26-period exponential moving average (EMA) from the 12-period EMA, while the signal line is a 9-period EMA of the MACD line. One of the primary uses of MACD is to identify trend reversals. When the MACD line crosses above the signal line, it is a bullish signal indicating that the trend is likely to shift to an upward direction. On the other hand, when the MACD […]

During the earnings season, investors and stock market traders pay attention to many different variables that affect the stock market. This includes financial data and world issues. This article will cover these factors. Economic data Several major indicators, such as unemployment, GDP and GDP growth, can affect the stock markets. Although not every piece of economic data has a direct impact on the stock market, these indicators can trigger expectations of government action. One of the biggest economic indicators is GDP, which is the dollar value of all goods and services produced in a country during a particular time period. While a good GDP figure can boost share prices, a bad one can have the opposite effect. Another indicator is the Purchasing Managers Index. This is a measure of the growth of the manufacturing sector. A positive figure suggests that businesses are performing well and that their earnings are likely to increase. The housing and construction sector is considered an important part of any economy. The number of construction projects is another indicator of a healthy economy. High construction activity […]
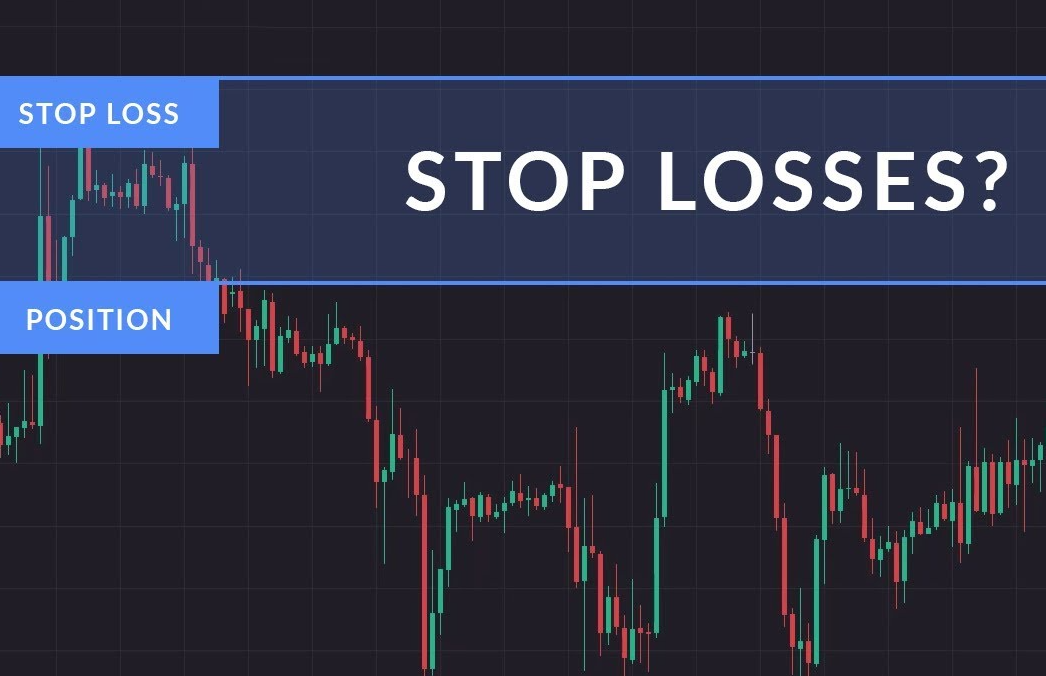
Using stop losses can help you limit your losses. Depending on how much money you have to lose, you can set a limit of one to three percent of your portfolio value. You may want to set the limit lower if you have had some losses recently. You can also choose to use a trailing stop loss. The downside to using stop loss orders is that they lock in your losses. This means that if you sell at $97 and then a buyer comes along, your order will be cancelled. It may also cause you to take a large loss if you place it too far off the current price. When you use a stop order, make sure it’s far enough from the current price to avoid a large loss. Stop-loss orders are often used by investors to limit their losses when they open new positions. For example, a trader might buy a hundred shares of a new tech stock at $25 a share. To avoid a large loss, he or she would set a stop-loss order at twenty percent […]
Choosing a moving average for swing trading can be tricky. Many swing traders prefer using a higher period setting because the higher it is, the later it will be – so the lower it is, the earlier it will be, and vice versa. You can also use a lower period setting to confirm trend changes – but remember, the higher the period, the later it will be. So, you can’t depend solely on a moving average to be successful at swing trading. The best way to use a moving average for swing trading is to follow a trend. Traders can use this indicator to confirm their trades, as it smooths out price fluctuations and incorporates older data. However, the first and most important thing to remember is that past performance is no guarantee of future performance. A better way to determine a trend is to use the longer-term chart. However, if you’re a new trader, you can also use the short-term chart as a guide. In swing trading, a moving average can be a powerful tool, but it must be […]
There are several indicators that you can use to make money swing trading. A moving average is a popular indicator, and is used to validate the direction of an asset’s price behavior over a specified period of time. The moving average can be created in two basic styles, simple and exponential. Simple moving averages are the easiest to use and provide the most recent statistics. The exponential version gives you more recent data and is best suited for shorter-term investment stocks. The Donchian Channel is probably the most common and straightforward indicator. It helps you identify buy lows and sell highs. Another tool that can help you find a profitable trade is the OHLC indicator. The Zig Zag indicator will help you find swing highs and lows, but it’s best used in conjunction with price action. While all three indicators are helpful, they won’t make your life easy. You must know how to interpret them properly. Another indicator for swing trading is the Relative Strength Index. This indicator is a trend indicator that shows when an asset is overbought or […]

If you’re new to the world of swing trading, you may be wondering, “What is swing trading?” Here’s a quick guide to what swing trading is. As its name implies, it involves trading stocks and options on a swing basis. Swing traders look at the chart of an asset to determine its entry point, set a stop-loss level, and anticipate when they want to exit. This allows them to maximize profits and minimize risks. Price action is often a daily fluctuation, bouncing around a range or not getting too close to a specific value. The swing trader might believe that the stock’s price will be fluctuating daily, but a long-term hold will probably not yield much profit. In other words, if you’re able to pick a stock that will fluctuate every day, you’ll profit. The key to swing trading is learning how to interpret charts and use technical analysis tools to make smart decisions. Technical analysis tools such as moving averages are essential for swing trading. Moving averages allow swing traders to use a moving average to smooth out price […]
For day traders seeking robust real-time Forex trading charts and information, ForexRate emerges as an invaluable resource. Offering a user-friendly interface and comprehensive data, it empowers traders to make informed decisions swiftly. With features like customizable indicators and live Forex market updates, it fosters a dynamic trading environment. Its free accessibility ensures accessibility for all levels of traders, fostering a vibrant community of learners and experts.